
It's science: Why September 1st is the start of meteorological fall

Did you know there are two different sets of seasons, and thus two different falls every year? Why? It's science!
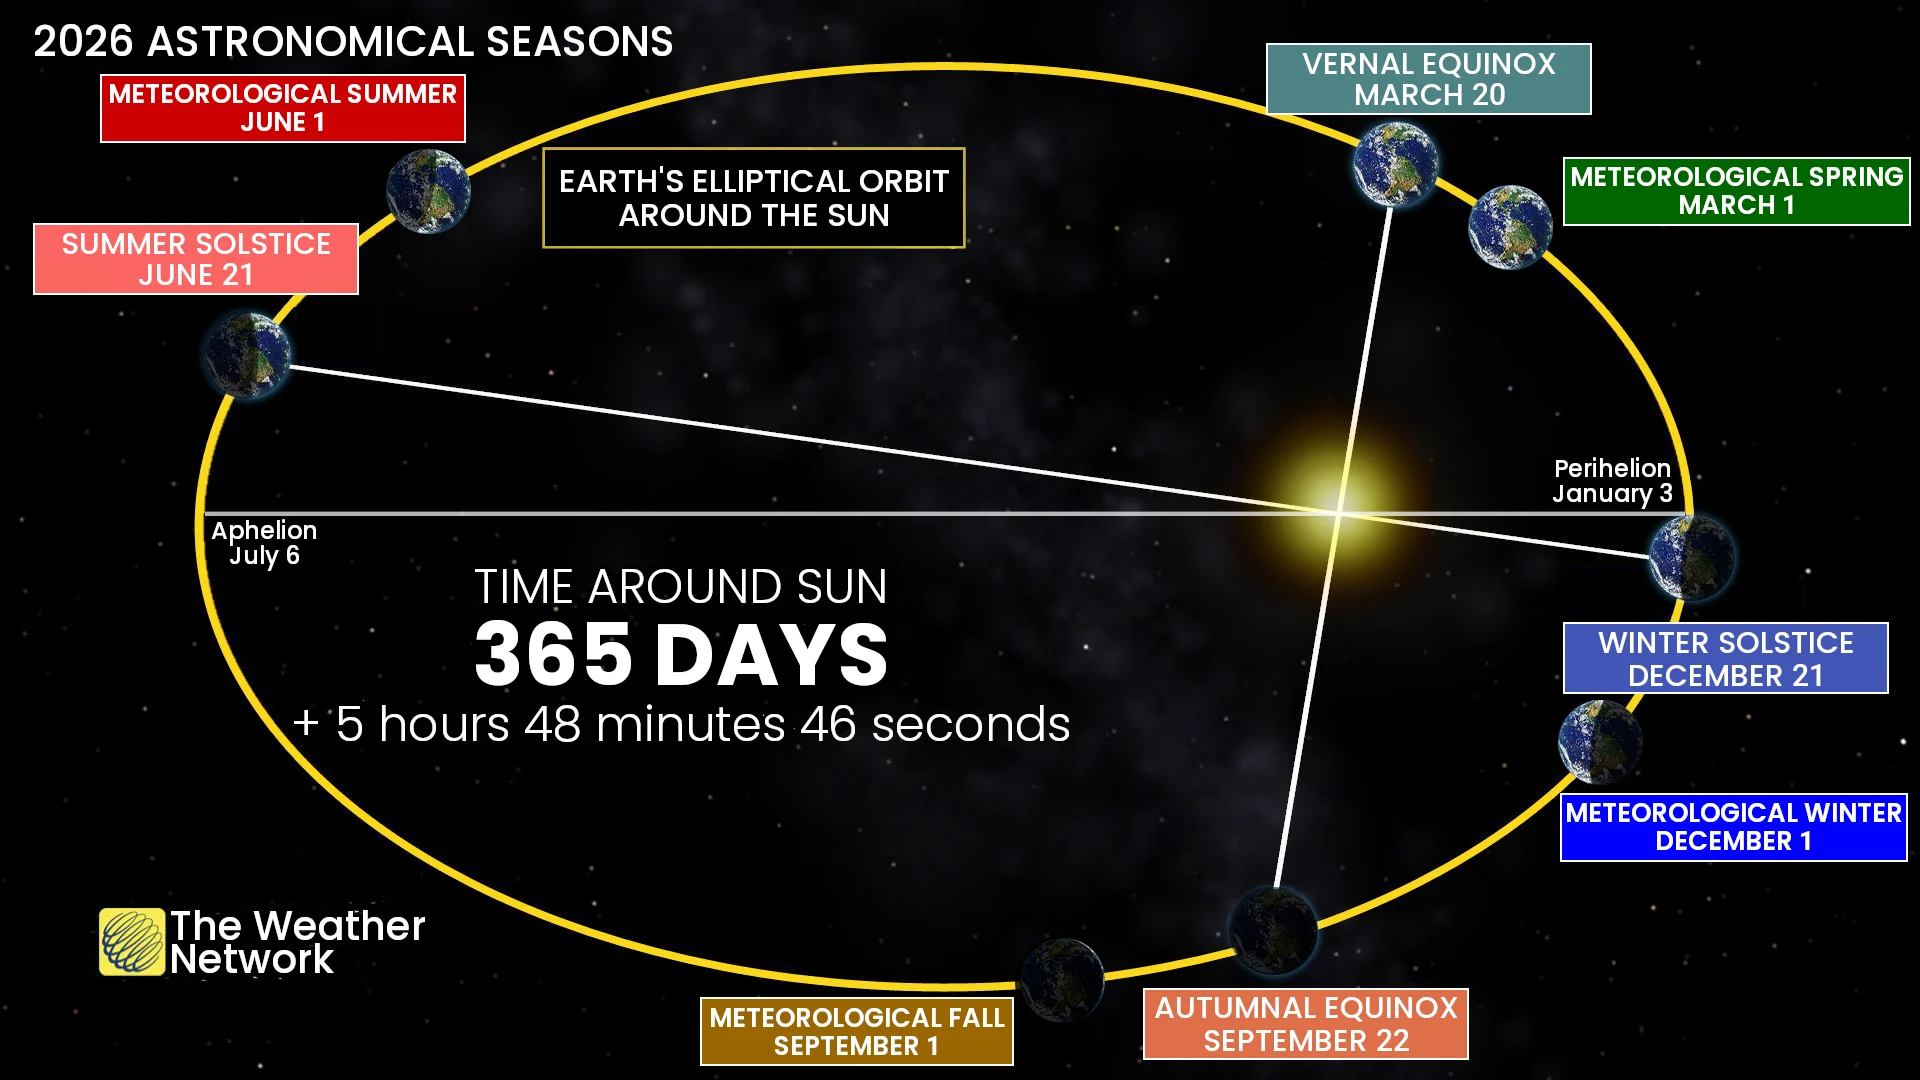
Astronomically, the first day of autumn is on the fall equinox, which — in the northern hemisphere — always occurs around the 22nd of September. However, for meteorologists and climatologists, the season actually begins three weeks earlier, on the 1st of September. This is the story behind meteorological fall.
Throughout the year, most calendars note four different dates to mark the passage of the seasons. Each of these dates is keyed to specific 'milestones' in the Sun's annual journey across our daily skies.
In the northern hemisphere, the June Solstice represents when the Sun reaches its highest point in the sky, with the 'subsolar point' over the Tropic of Cancer, at just over 23°N. The September Equinox is when the 'subsolar point' on Earth sits directly on the equator, with it tracking from north to south at that time. On the December Solstice, the Sun reaches its lowest point in the sky, with the subsolar point above the Tropic of Capricorn, at just over 23°S. Then, on the March Equinox, the subsolar point is on the equator once again, this time heading from south to north.
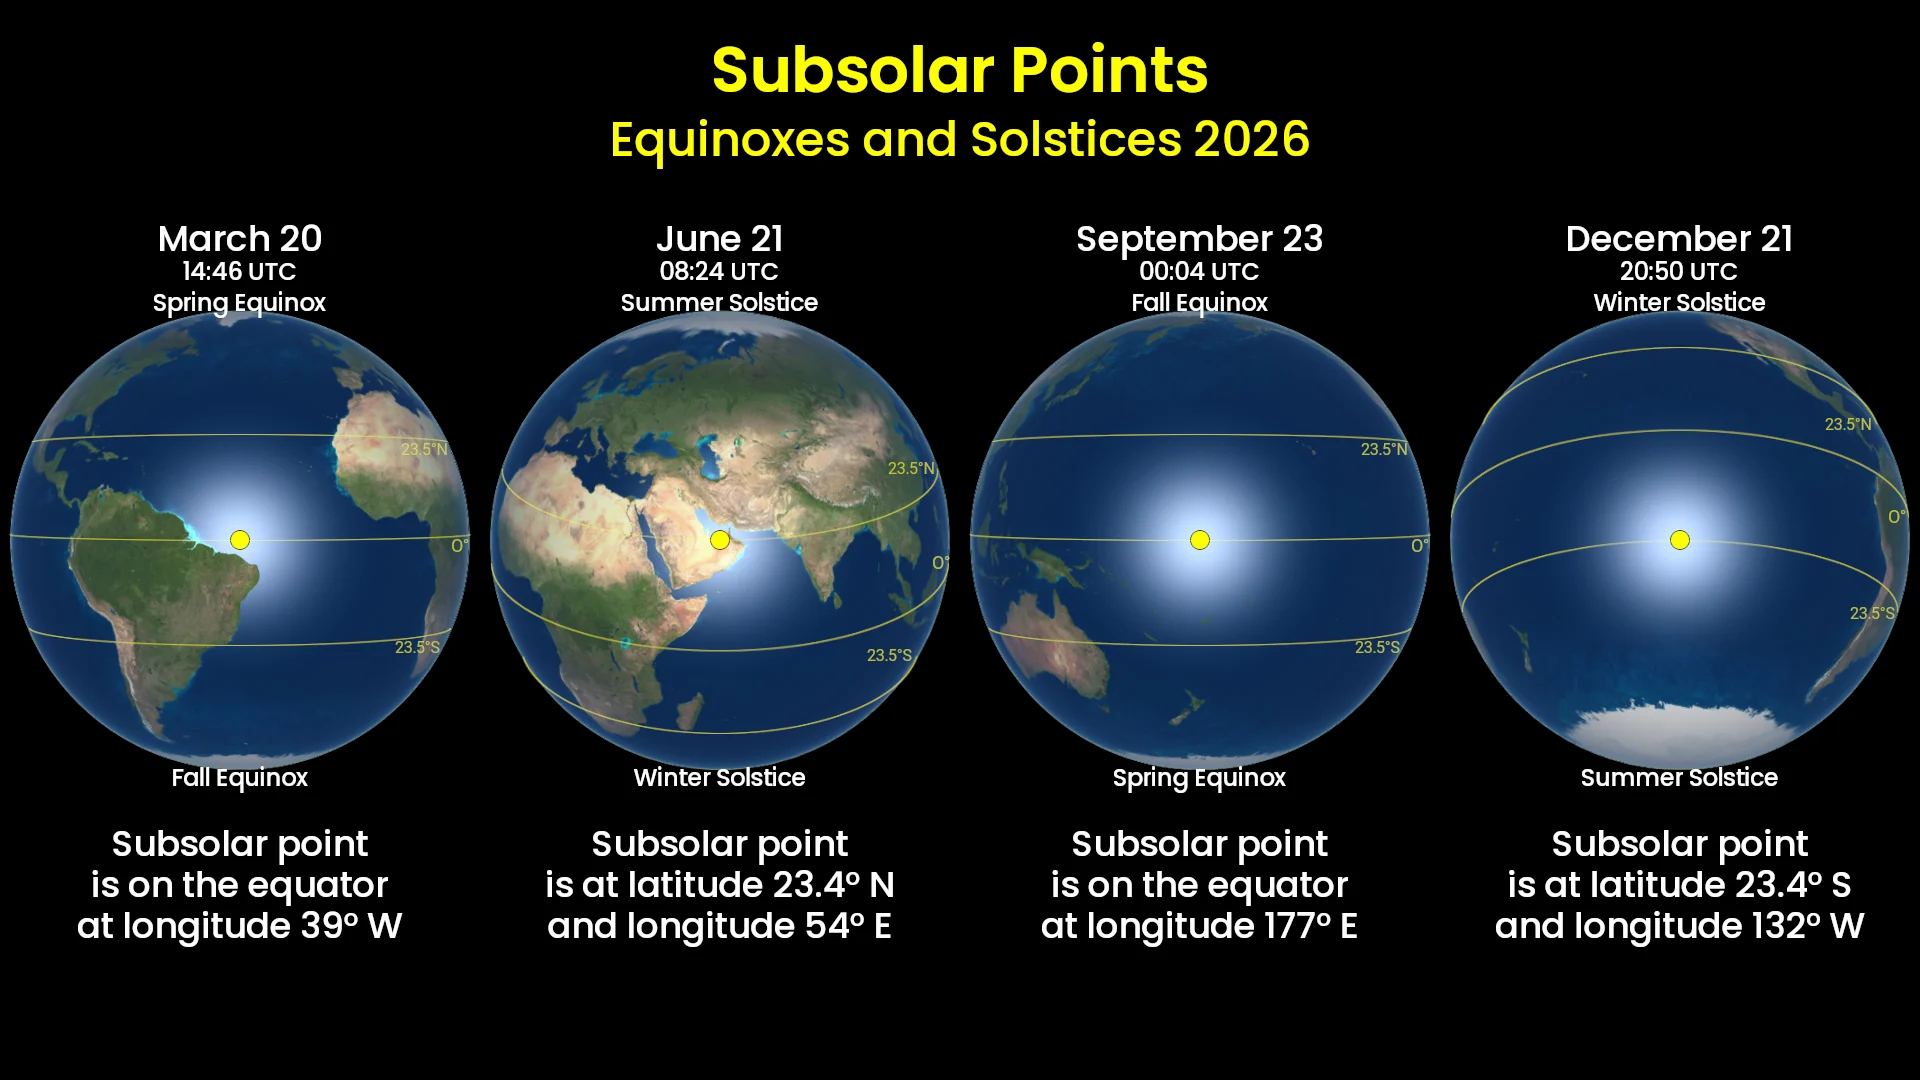
The locations of the subsolar points on the Equinoxes and Solstices for 2026 shows where the Sun's rays shine directly down onto the planet at those dates and times. (Celestia/Scott Sutherland)
Meanwhile, in the southern hemisphere, this is all flipped on its head, with the June Solstice marking when the Sun is lowest in the sky, and so on.
These dates, and the seasons that lie between them, have been observed for centuries.
The reason for these seasons, and for these specific dates, is Earth's tilted rotational axis.
As our planet orbits the Sun, that motion traces out a flat, nearly perfect circle in space, which we call the ecliptic. However, the ecliptic doesn't line up with Earth's equator. Instead, the two are offset, with the equator tilted by approximately 23.4 degrees with respect to the ecliptic.
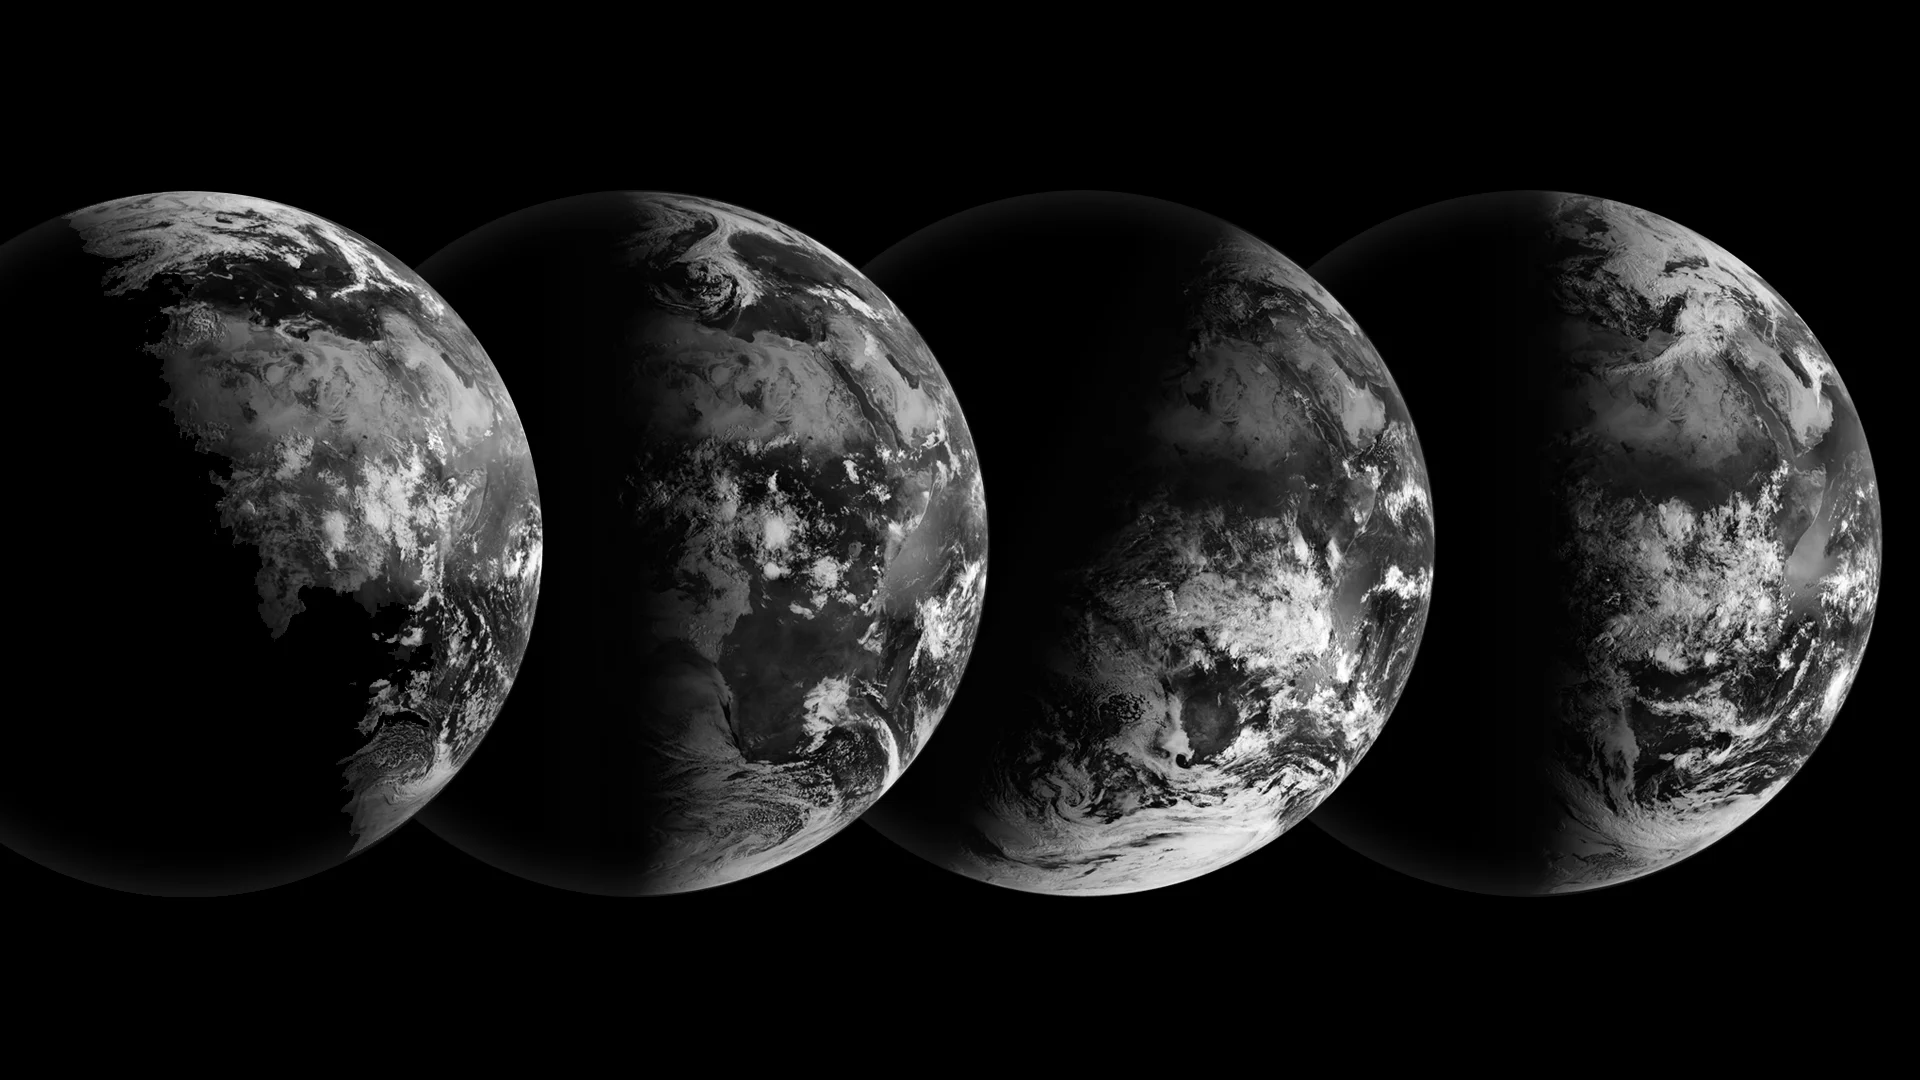
These satellite views of Earth show the start of the four seasons. From left to right, with respect to the northern hemisphere, we see the summer solstice, fall equinox, winter solstice, and spring equinox. Credit: NASA
So, during each of our year-long journeys around that orbit, Earth's tilt causes our perspective on the Sun to change.
For half of the year, the Sun climbs higher in our sky each day, until it reaches its highest point, on the summer solstice. Then, for the rest of the year it gets lower in the sky every day, until it reaches its lowest point, on the winter solstice. The pattern then repeats.
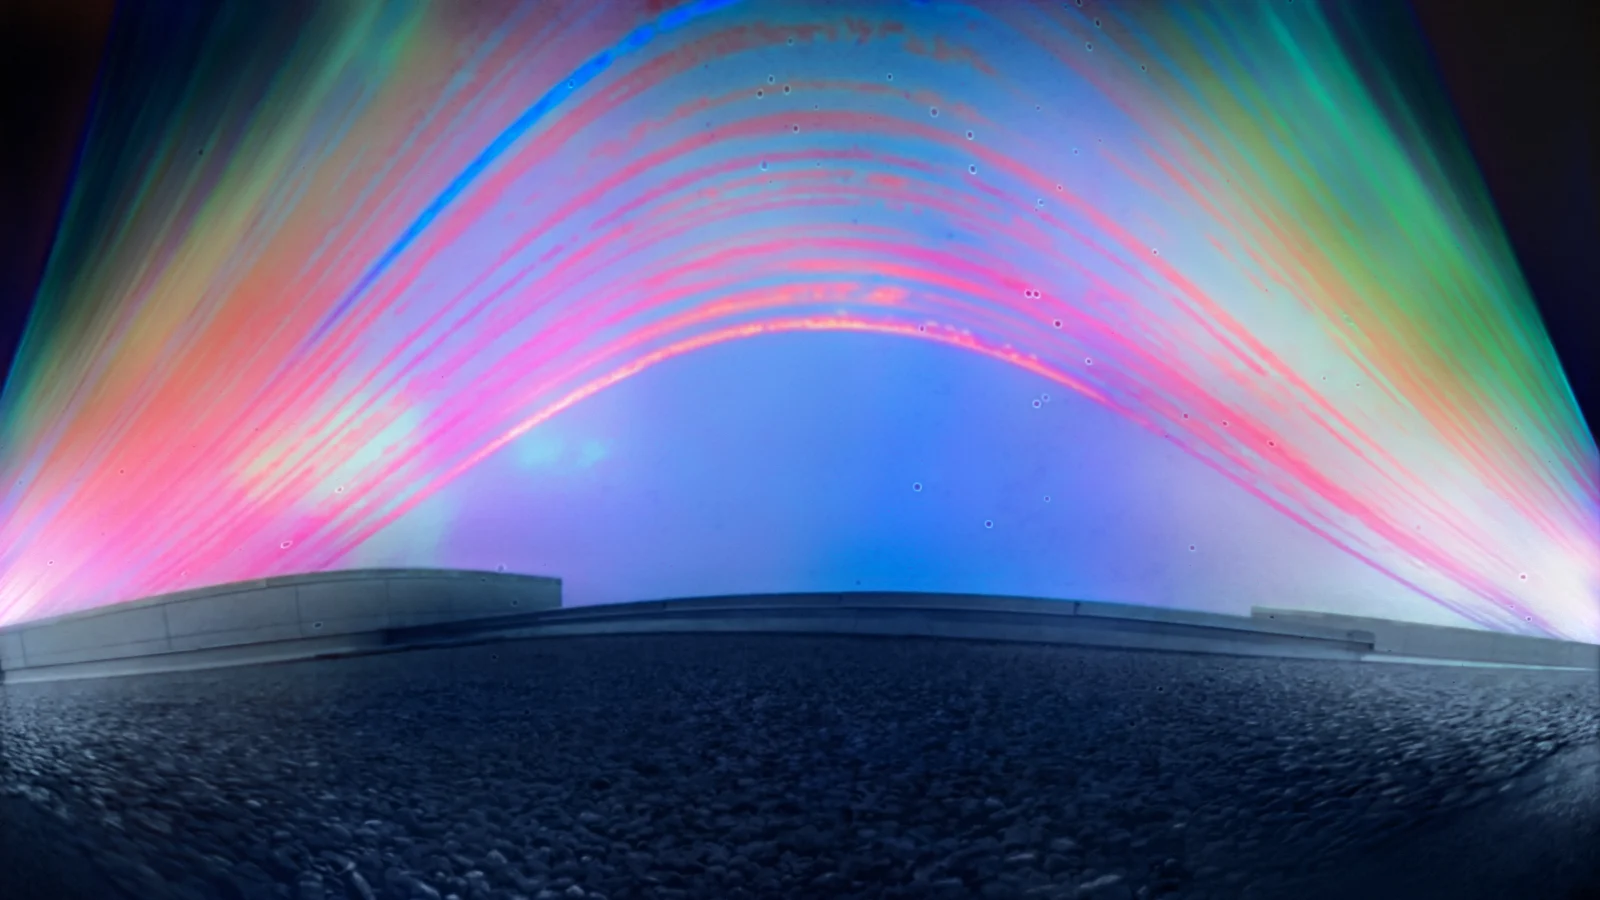
This 'solargraph' image captures the Sun's path across the sky, day by day, between June 21 and December 21, 2023, from atop Weather Network Headquarters. Credit: Bret Culp
READ MORE: What is a solargraph? How to record the Sun's seasonal journey across our sky, all in one image
This astronomical timing works fine to define our seasons. However, when it comes to tracking weather and climate data, the astronomical seasons don't measure up.
The start and end dates of the astronomical seasons typically fail to capture the weather that most defines a particular season. Also, they definitely do not mesh well with how we keep records of weather conditions throughout the year.
Shifting alignment
When keeping weather and climate records, consistency is essential.
Daily, weekly, monthly, and even yearly records satisfy this requirement quite well. A day is always 24 hours, a week is always 7 days, and except for the occasional leap year, we can count on each month staying the same length, and each year having 365 days. This helps atmospheric scientists to easily make comparisons, find extremes, and track trends in their weather records.
Comparing seasonal trends is important too. However, astronomical seasons are far from consistent. Due to the influence of the Moon and the other planets, slight changes are introduced into the timing of Earth's orbit and rotation. As a result, the exact day and time of the equinoxes and solstices changes year to year.
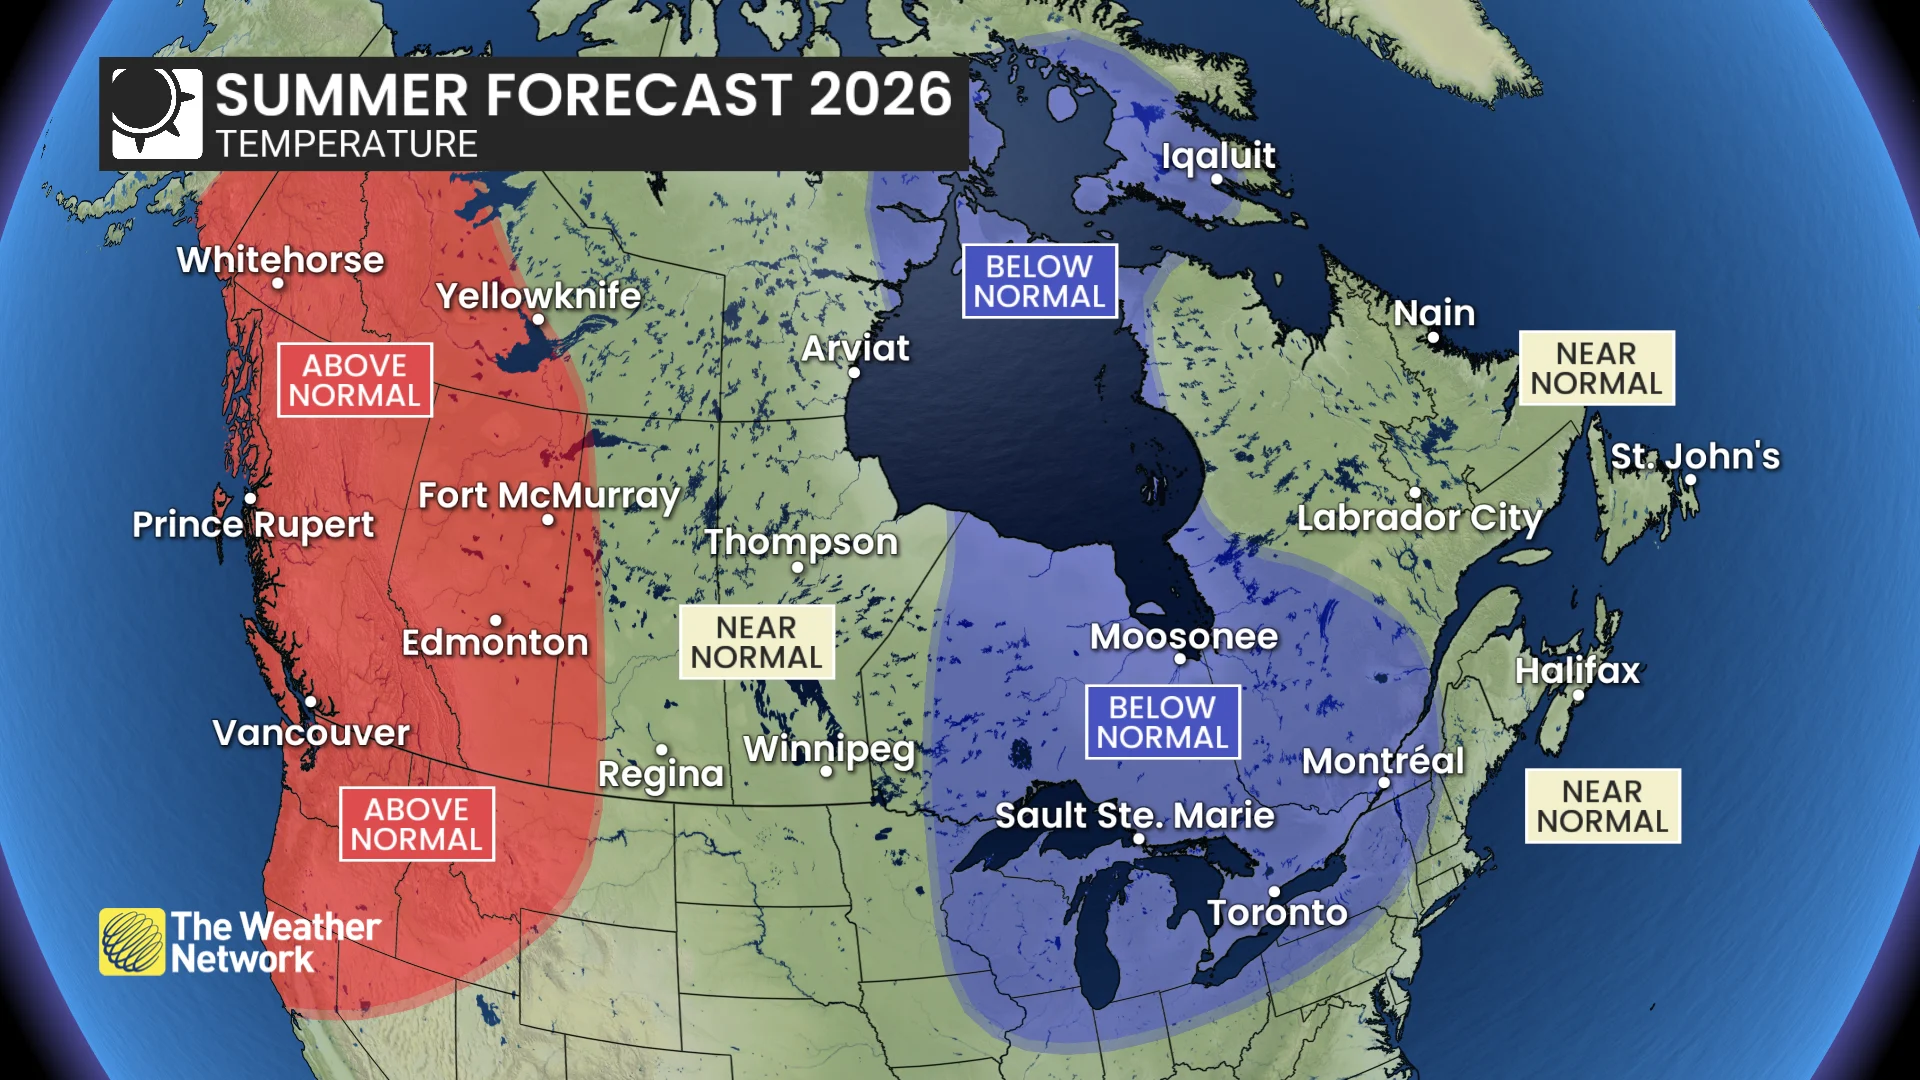
Without meteorological seasons for comparison, the 'above normal', 'normal', and 'below normal' regions of this Summer Forecast map would be much more difficult to predict. (The Weather Network)
These days, modern computing makes calculations and comparisons a trivial matter. For the roughly 200 years before computers, though, meteorological record-keeping and calculations were done by hand.
So, using astronomical seasons was simply too cumbersome.
To better align the seasons with how weather records were kept, meteorological seasons were invented.
DON'T MISS: The planets visit with the Moon throughout the month of September
Each meteorological season is still three months long. However, unlike their astronomical counterparts, each has a consistent length, year to year, and they all align perfectly with our calendar months.
Meteorological spring begins on the 1st of March, meteorological summer starts on the 1st of June, meteorological fall begins on the 1st of September, and meteorological winter starts on the 1st of December.
Does it make that much of a difference?
Meteorological seasons do more than bring consistency to seasonal comparisons. They also tend to capture the most 'representative' temperatures of each season.
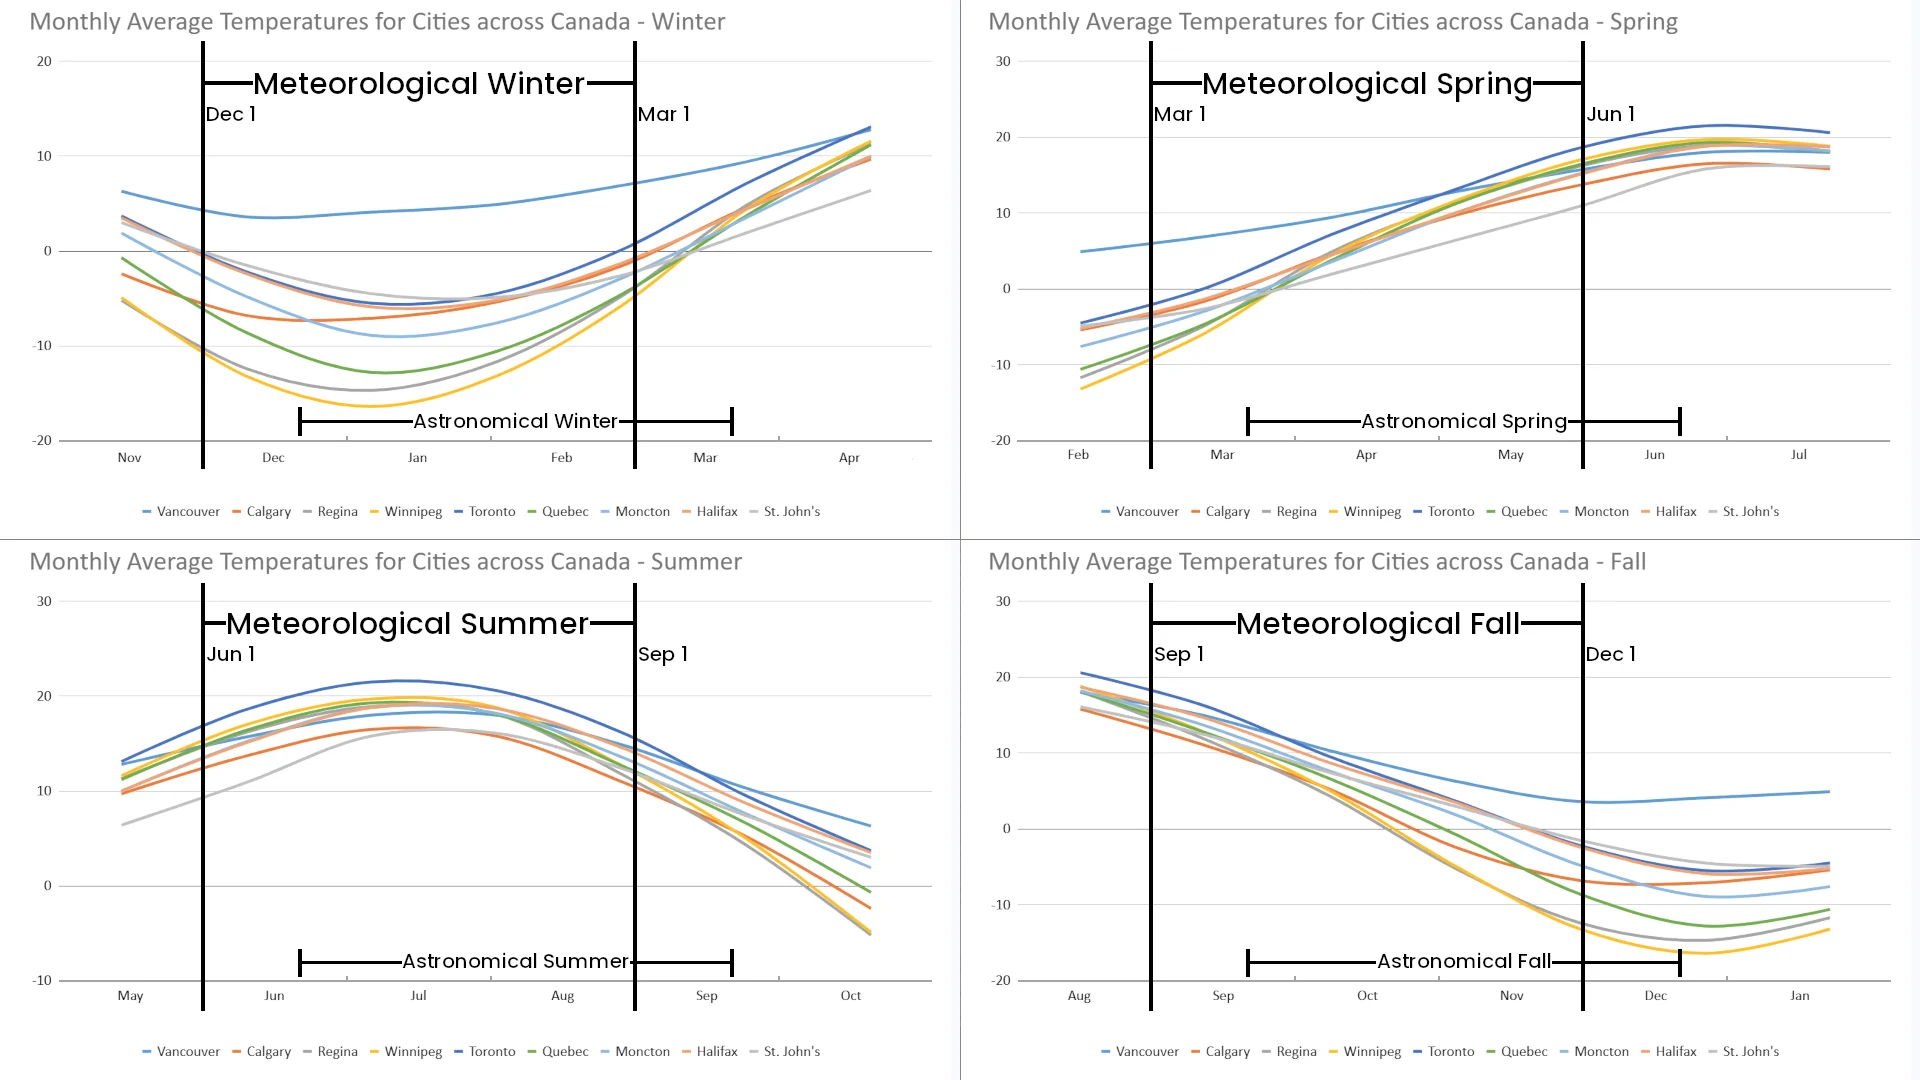
This graph plots average daily temperatures for seven cities across Canada for Winter, Spring, Summer, and Fall. The start and end dates for both meteorological and astronomical seasons are indicated. (Data from Environment and Climate Change Canada)
Canada is a very large country, and the different regions experience different weather throughout the year. Even so, when the average monthly temperatures for different cities from coast to coast are plotted on the same graph, they all experience roughly the same trends with regards to the seasons.
As the above graphs show, compared to the astronomical seasons, meteorological seasons are much better at capturing the most representative temperatures for each season — coldest for winter, hottest for summer, and 'transitional' for spring and fall.
That makes them even more useful for tracking trends.