How spaghetti models and cones help refine your forecast

Forecasters use some tasty-sounding tools to generate accurate predictions
Weather forecasting is a science filled with lots of technical jargon. But some of the terms meteorologists use on a regular basis might just make you hungry.
Have you ever heard of a spaghetti model plot? It’s not the perfect plate of pasta. These maps are a critical forecasting tool when a dangerous storm lurks offshore. Forecast cones are another important part of a hurricane forecast—especially when a system threatens land.
Here’s a look at how we use spaghetti models and forecast cones, and why they’re important to your forecast when hazardous conditions may threaten your community.
DON’T MISS: Hurricane forecasts are better today than ever before—here’s how
Spaghetti models show a range of outcomes
No weather model is 100 percent accurate. Meteorologists use their knowledge and experience to identify the strengths and weaknesses of each computer model, blending their output together to generate an expert prediction.
Forecasters use many different weather models in the course of their work, especially when there are hurricanes on the horizon.
Each weather model has a slightly different view of our world, running unique algorithms and focusing on various aspects of the atmosphere to help guide forecasters in the right direction.
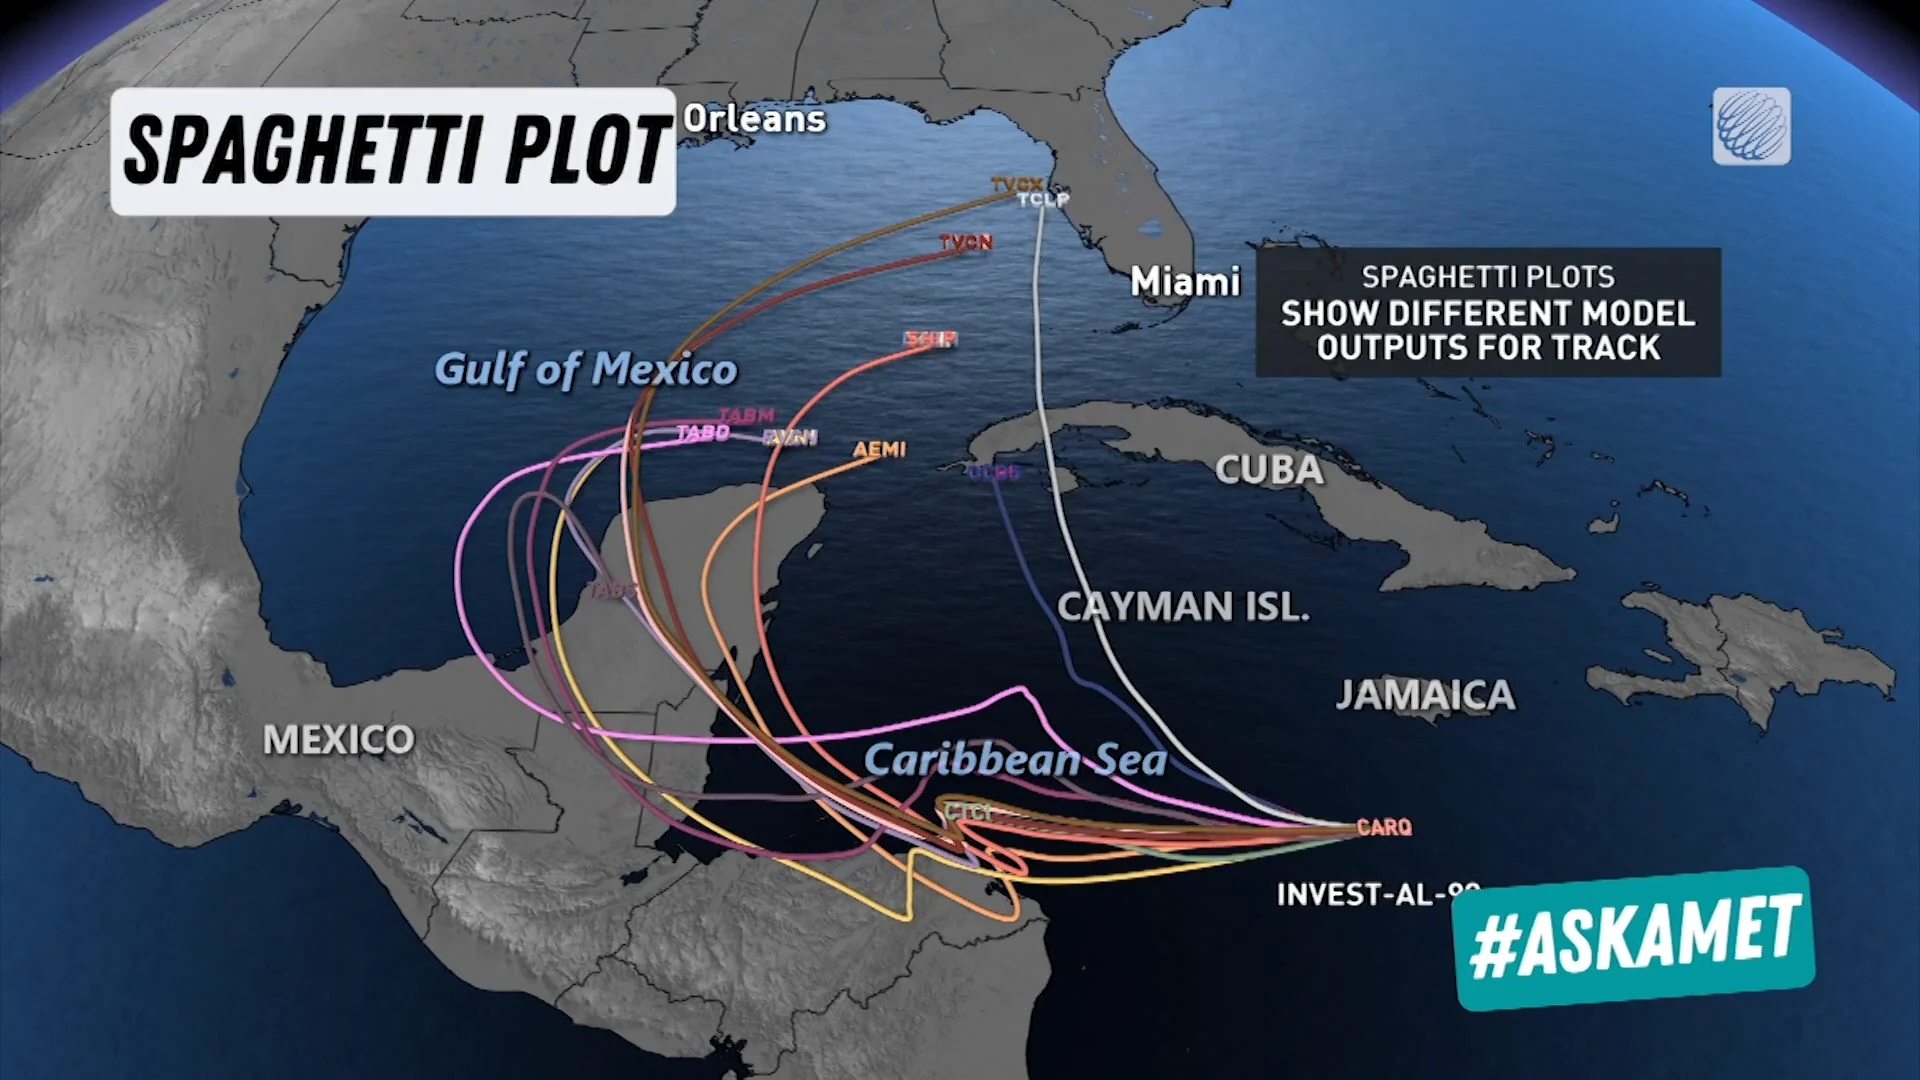
A spaghetti model plot charts out a dozen or more weather model runs, showing the potential track and intensity of a given storm over the course of about a week’s time. All the lines plotted together look like…well, a bunch of spaghetti thrown at the map, hence the name.
These plots are very helpful to meteorologists because they show a full range of potential outcomes. If the lines are tightly packed and all curving in the same direction, it can give forecasters increased confidence that the models are pointing them in the right direction.
On the other hand, if the lines are all jumbled up and pointing in different directions, it means that there’s serious disagreement between each individual model and there’s great uncertainty in a storm’s future trajectory.
Forecast cones show the margin of error
Another mainstay of hurricane forecasting is the cone of uncertainty. Think of these forecast cones like the margin of error in a storm’s track forecast. The cone applies to the path of the very centre of the storm.
RELATED: Why does your long-range forecast change so often?
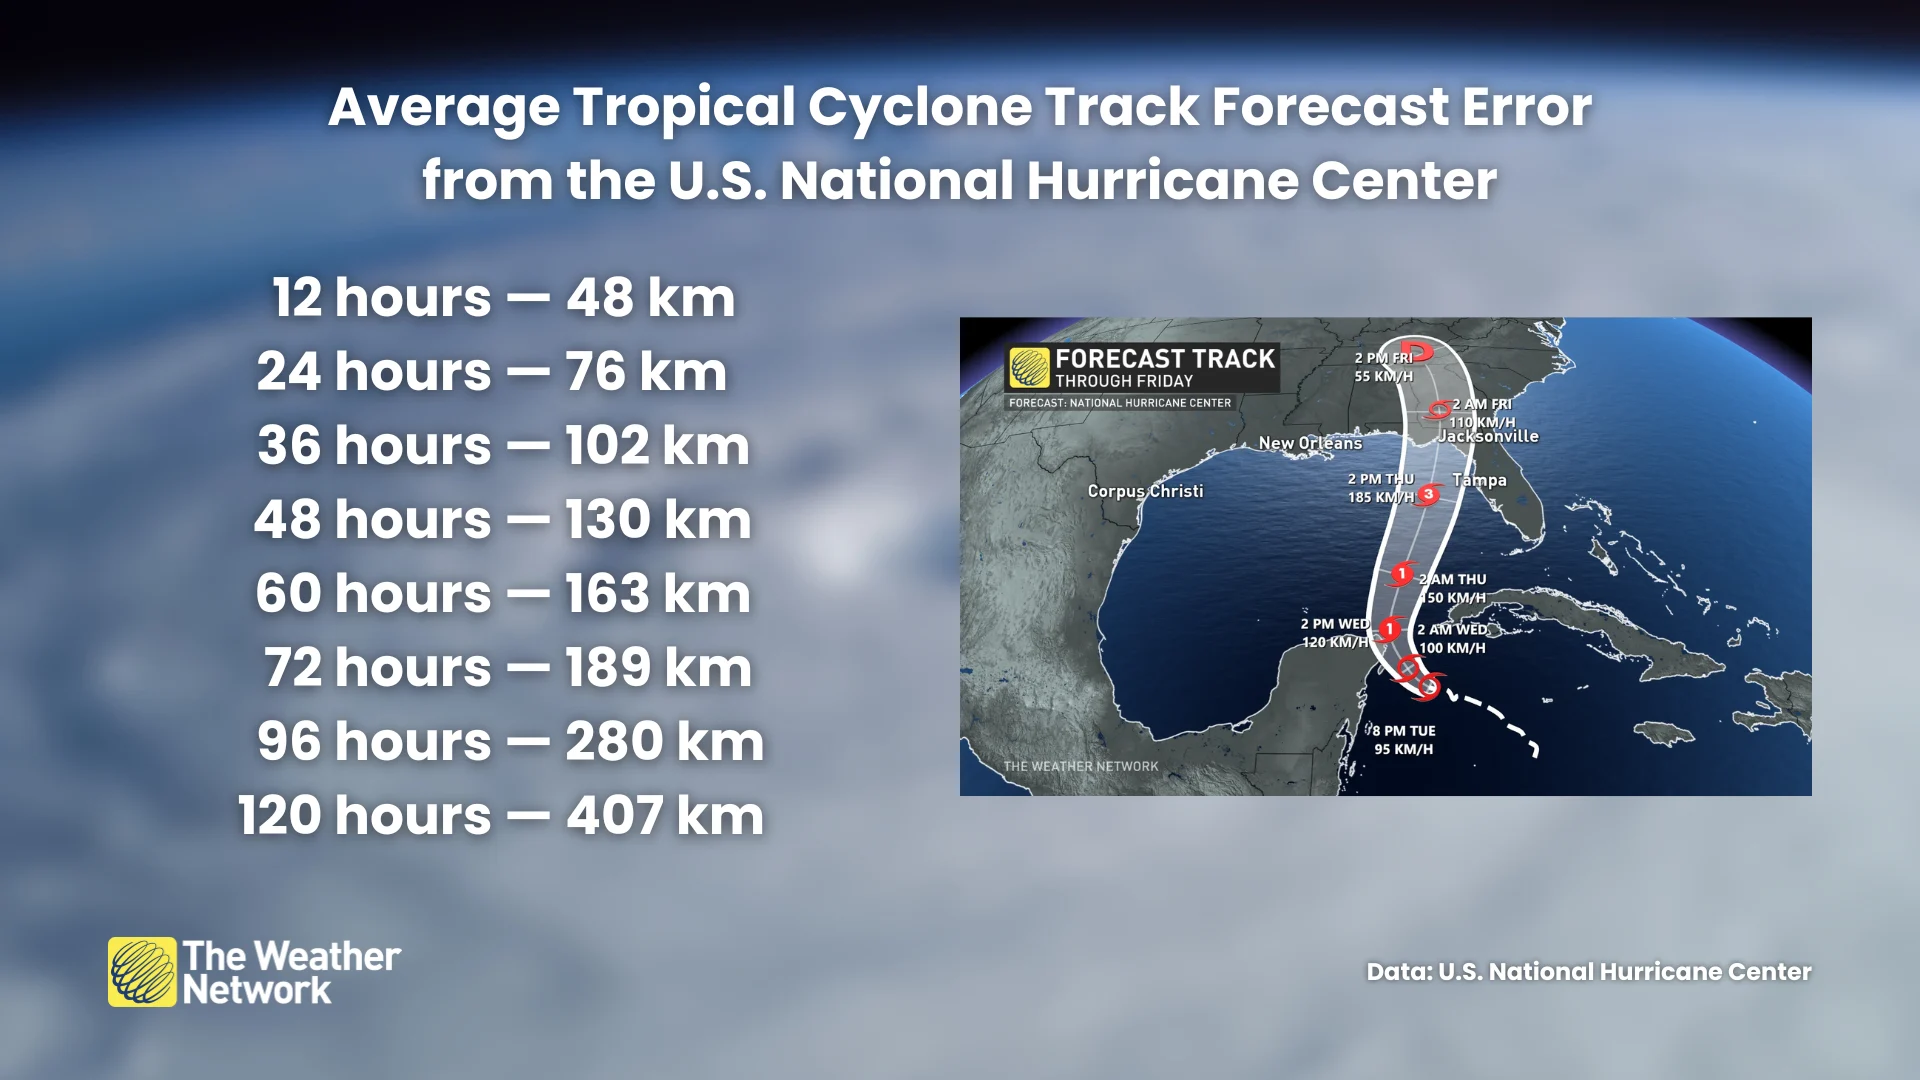
The U.S. National Hurricane Center (NHC) assesses their track forecasts at the end of each season, calculating their average error at each timestep. A 12-hour forecast is more accurate than a 120-hour forecast, which is why the cone grows larger with time.
Historically, the centre of a tropical cyclone stays within the cone of uncertainty two-thirds of the time. This means that, based on the NHC’s average accuracy from past seasons, the storm will more likely than not travel in the general direction in which the forecast cone is pointing.
While the forecast cone is a good indicator of where a storm is likely to travel, it doesn’t account for the size or overall impacts of a storm. Dangerous winds, life-threatening floods, heavy rain, and a threat for tornadoes can stretch hundreds of kilometres away from the storm, affecting communities not covered by the forecast cone.